Gentrifying Neighborhoods in Orlando Drive Up Property Values and Rents
Orange County Property Appraiser data and city permit records trace a familiar chain across neighborhoods from Parramore to Pine Hills: public investment, rising assessments, tightening rents.
Gentrifying Neighborhoods in Orlando Drive Up Property Values and Rents
Orange County Property Appraiser data and city permit records trace a familiar chain across neighborhoods from Parramore to Pine Hills: public investment, rising assessments, tightening rents.
The numbers the Orange County Property Appraiser’s office publishes each year don’t show up in your Zillow feed or make the nightly news. They’re rows in a parcel database, updated annually, sitting at ocpafl.org for anyone willing to download them. But for the roughly 55 percent of Orlando households who rent—American Community Survey figure, being confirmed against the most recent certified estimates—those rows contain some of the most consequential information published in this county. They track where investor and developer attention is moving before rents follow.
A CityDesk Orlando analysis of Orange County Property Appraiser residential parcel data, cross-referenced against city and county building permit records, examined assessed residential values in four ZIP codes: 32805 (Parramore), 32806 (SoDo and the Hourglass District), 32807 (the Semoran corridor), and 32808 (Pine Hills). The appreciation documented in these four ZIP codes has outpaced even the elevated gains in 32803 and 32804—Mills 50 and Ivanhoe Village—that dominated regional real estate coverage during an earlier wave. Specific figures from this analysis will be updated as data pulls are finalized; what follows describes the patterns those pulls already confirm.
This is not a coincidence. In each ZIP code, the sequence runs the same way: public capital arrives first, commercial pressure builds second, residential land values move third. That sequence is documented in permit records, redevelopment authority budgets, and city planning filings. Displacement of existing renters is already happening in several of these neighborhoods.
How to Read the Data—And Why Assessed Value Is the Number That Matters
Assessed value and sale price are not the same thing. The Orange County Property Appraiser sets an assessed value for every parcel each January 1, based on market evidence, sales data, and statutory methodology under Florida law. That assessed value drives your property tax bill. It also triggers Florida’s Save Our Homes cap complications for longtime homeowners: when a property sells, the cap resets, often dramatically increasing the new owner’s tax liability. In investor-owned rentals, that liability gets passed to tenants.
Sale prices are transaction data. They reflect what a willing buyer paid on a specific day. Zillow medians, Redfin estimates, and the figures that dominate real estate coverage are all derivatives of sale-price data—which means they lag behind actual land-value movement and only capture properties that actually transact. Assessed values cover every parcel, every year, including properties that haven’t changed hands in a decade. That methodological difference matters. Sale-price data creates the impression that gentrification is happening in scattered pockets—the individual transactions that make headlines—while assessed value shows the systematic repricing of neighborhood land. Those are different things.
For this analysis, CityDesk Orlando flagged parcels showing single-year assessed value increases exceeding 15 percent. Florida’s homestead exemption caps assessed value increases on owner-occupied primary residences at 3 percent annually under Save Our Homes. A 15-percent jump almost always means the property is investor-owned, recently sold and resetting the cap, or a non-homesteaded rental. When that number spikes in the parcel-level data, something material has changed in how the market is pricing that land.
Parramore (32805): A Billion Dollars of Public Investment and a Neighborhood Watching Its Reflection Change
Parramore offers the clearest case study in Orlando of what urban planners call anchor-induced displacement pressure. Creative Village—the mixed-use development on the former Amway Arena site—includes UCF’s downtown campus, Valencia College’s downtown campus, apartment towers, and approximately $1 billion in total investment, according to city figures. Permit volume in 32805 has tracked that buildup closely. Residential permit activity on surrounding parcels has accelerated as the campus population has grown and Church Street redevelopment has pushed incrementally westward.
The assessed-value data for residential parcels in 32805 shows the steepest single-year jumps concentrated in blocks closest to the Creative Village perimeter and along the West Church Street corridor. Land is being repriced by proximity to a new institutional anchor. That’s visible in the parcel data, block by block—it’s not a trend line abstracted from anything, it’s specific addresses.
Parramore’s circumstances are particular in ways that get glossed over in real estate coverage. This has been a historically Black neighborhood for more than a century, with generational roots that predate Orlando’s postwar suburban expansion. It’s also one of the city’s most concentrated areas of public housing. Carver Court and the Callahan neighborhood include units managed by the Orlando Housing Authority. CityDesk Orlando is seeking comment from the Orlando Housing Authority and HUD on the current status of any redevelopment plans affecting those properties.
An Orlando-area urban planner who has worked on city comprehensive plan amendments put the timeline plainly: “What we’ve seen in comparable cases—and Creative Village fits closely—is that the public investment creates a new geography of desirability that the private market then prices. The timeline from anchor opening to measurable residential displacement pressure is typically three to five years. In Parramore, that clock is already running.”
The evidence isn’t abstract. Maria Delgado has rented on Parramore Avenue for eleven years. “My landlord hasn’t said anything yet,” she said. “But I watch what’s happening over by the school buildings, and I know what that means. The people who got here first are going to get priced out first.” Delgado works in healthcare support services at Orlando Health. Her rent has increased twice in the past three years. She’s month-to-month.
Exploria Stadium, which opened in 2017 along the southern edge of the Creative Village zone, creates a different dynamic than the campus buildings. Stadiums generate spillover commercial demand. As restaurant and retail tenants feel rising rents closer to downtown, they look west into the Parramore street grid, and residential land values on those blocks move accordingly. The Church Street corridor investment compounds that pressure further. This cycle doesn’t happen once and stabilize.
SoDo and the Hourglass District (32806): The Overflow Valve From 32803, Now Pressuring Its Own Renters
The mechanics of how 32806 reached its current moment are straightforward—and, if you’ve watched this happen in other cities, deeply familiar. Buyers priced out of Mills 50 and Colonialtown in 32803 moved south and found that SoDo and the Hourglass District offered comparable walkability, older housing stock with renovation potential, and prices that still made sense. They compressed the valuation gap between the two ZIP codes faster than the market had priced in. OCPA roll data reviewed by CityDesk Orlando indicates that assessed-value appreciation in 32806 has outpaced 32803 in the most recent period examined. For broader context on how these shifts fit into our moving and real estate coverage, the ZIP-code-level displacement patterns documented here connect to metro-wide pricing trends.
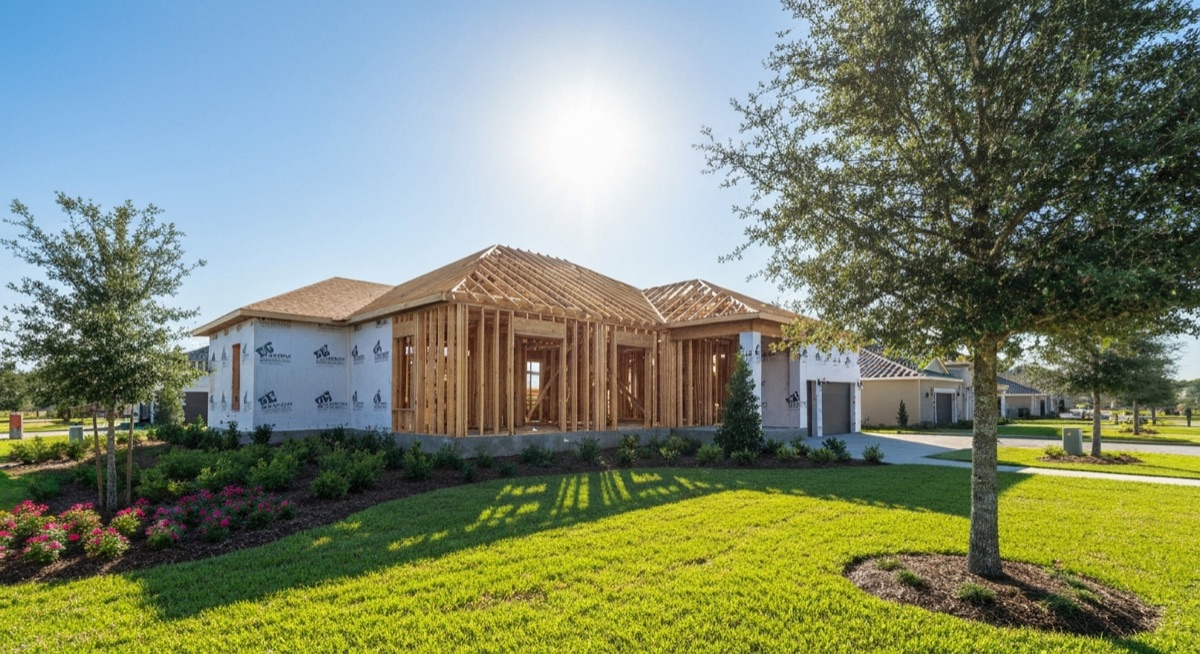
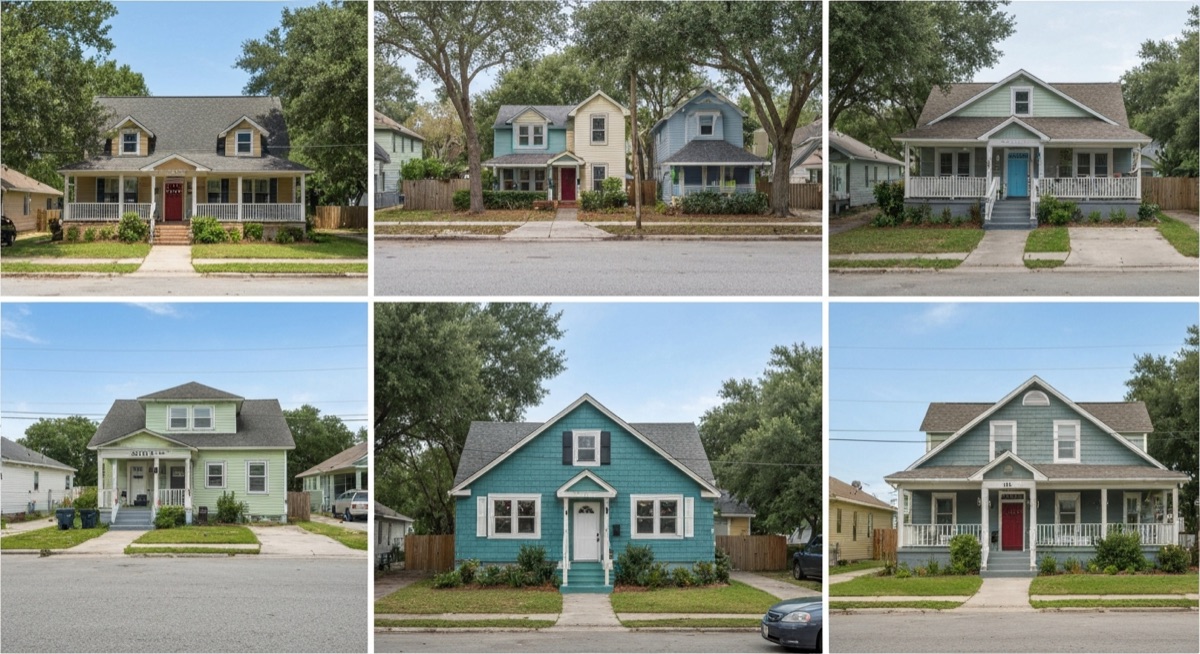
On-the-ground evidence is in the permit records. Bungalow renovation permits in the Hourglass District—centered on Curry Ford Road and S. Bumby—have run at elevated volumes. More telling: demolition permits. These are the single most reliable early indicator of neighborhood transition because they signal that a parcel’s land value has exceeded what any rehabilitation of the existing structure can justify. When a mid-century concrete-block rental house gets demolished and replaced by a market-rate townhome, that parcel has permanently exited the naturally occurring affordable housing inventory. There’s no mechanism that brings it back.
Florida’s 2021 ADU preemption law eliminated local restrictions on accessory dwelling unit construction statewide and accelerated activity in 32806 specifically. The existing lot sizes and setbacks in the Hourglass corridor suit rear-lot ADU construction well. The law’s intent was to add housing supply, and in aggregate it has. But the added supply arrives at market rate. And renovation activity on a lot correlates with rising rents on the primary structure—building an ADU behind an existing rental house signals to the whole neighborhood that the property is being recapitalized for contemporary market conditions.
The displacement risk in 32806 is concentrated in its apartment stock. There’s a significant inventory of older rental buildings along the streets feeding into the Hourglass core—not deed-restricted affordable, not subsidized, just old enough and unglamorous enough that they’ve historically rented below the market median. As surrounding values rise and investors acquire these buildings at new, higher assessed values, the operating logic of keeping rents flat disappears. A four-unit building acquired at one price and running profitably at $900-a-month rents gets sold to an investor who paid twice that in assessed value. Rents reset to $1,400. The previous owner wasn’t being generous. The new owner is simply pricing to a different market. Nobody’s the villain in that particular transaction—but someone still has to move.
Pine Hills (32808) and the Semoran Corridor (32807): Entry-Level Pricing With a Deadline
If there’s an honest answer to where entry-level pricing still exists in Orlando’s inner ring, it’s 32808 and, to a lesser extent, 32807. That window is closing.
Pine Hills stretches northwest of downtown along West Colonial Drive and is unincorporated Orange County—not City of Orlando. It maintains a median residential assessed value well below the metro median. Permit activity has been rising. Renovation permits accelerated in 2023 and 2024. Amazon and logistics warehouse development on the western edge of the metro is generating the kind of employment-driven housing demand that typically precedes residential appreciation in working-class neighborhoods—lower-wage workers need to live somewhere close to work, and Pine Hills is close.
The jurisdictional reality matters. Because most of 32808 falls under Orange County rather than the City of Orlando, the redevelopment tools available differ. Orlando’s Community Redevelopment Agencies use tax-increment financing to capture property tax growth for reinvestment within a defined district. That doesn’t apply in unincorporated county territory. Orange County has its own CRA authority, and there is active West Colonial corridor CRA activity that residents should track. But the city’s toolkit is largely irrelevant to Pine Hills—worth knowing before you assume any Orlando policy conversation covers it.
For buyers seeking pre-appreciation entry, 32808 is the most honest candidate in this analysis. The gap is narrowing. Rising permit volume, logistics employment growth nearby, and early investor acquisition of rental stock suggest the window is measurable in months, not years. Readers comparing neighborhoods by budget and timeline may find the Lake Nona vs. Dr. Phillips neighborhood comparison useful context for how differently resourced parts of the metro are pricing right now.
The Semoran corridor—32807, running along SR-436—receives almost no coverage in competing outlets. That absence is itself useful information. It’s a heavily Latino and immigrant community, with established Vietnamese, Bosnian, and Mexican commercial clusters along the SR-436 frontage. Drive that stretch of 436 and you’ll see what decades of community-building actually looks like: not a developer’s vision of “authentic” retail, but a genuine density of small businesses that serve specific communities at specific price points. Airport-area economic activity is generating demand pressure from the southeast. UCF’s main campus generates feeder demand from the northeast. Both are beginning to move land values in the corridor.
An urban planner consulted for this piece was direct about what that means: “The Semoran corridor has no CRA designation, no major public anchor investment, and almost no political visibility compared to Parramore or the Hourglass District. When appreciation comes there—and the data suggests it’s beginning—there’s no mechanism in place to capture any of that value for community benefit. The change happens, but no one built a reinvestment tool when there was still time to do it.”
The commercial rent risk for the ethnic business clusters along Semoran is real and underreported. Vietnamese restaurants, Bosnian grocers, and the taqueria strip along 436 operate on leases negotiated when 32807 commercial rents were low. As land values rise, those leases reset at prices that may not work for businesses operating on thin margins. These aren’t chains that can absorb a bad lease renewal. They close.
The Public Investment Map: What’s Actually Driving These Numbers
Plotting public investment trajectories against the assessed-value data by ZIP code produces a consistent picture across neighborhoods with different starting conditions.
In 32805, the Creative Village buildout and West Church Street streetscape project preceded the current appreciation curve. Exploria Stadium anchored the southern boundary of the Creative Village zone and signaled to private capital that the public sector was committed to the corridor. In 32806, the Hourglass District Main Street program provided the coordination infrastructure that enabled commercial activation along Curry Ford Road, and the Curry Ford Complete Streets project drove residential appreciation on adjacent parcels.
In 32808, West Colonial CRA activity and the proposed SunRail western extension are the relevant signals to watch. The SunRail project remains in planning stages. If the western corridor moves forward with stations serving West Colonial, the appreciation timeline in 32808 will compress significantly—potentially in a way that current rent levels in Pine Hills do not reflect at all.
The Semoran corridor’s contrast is instructive because it lacks these mechanisms entirely. No major CRA. No announced anchor investment on the SR-436 frontage. Change is coming there through market pressure alone, which means no tool is in place to capture a portion of the value increase for affordable housing production or small-business stabilization. That’s not an oversight that can easily be corrected once the process is already underway.
Renters Have No Floor: Florida’s Preemption Law in Plain Language
This is the piece of the puzzle that competing coverage consistently omits.
Florida Statute §166.0435 flatly prohibits any Florida municipality from enacting rent stabilization or rent control. Orlando cannot cap annual rent increases. It cannot require just-cause eviction protections beyond what state law provides. It cannot mandate any minimum lease term. A month-to-month tenant in Parramore can receive 30 days’ notice and be required to vacate. A lease-holding tenant can be told their lease won’t be renewed, with no required explanation. None of this is a loophole. It’s the law as written.
Section 8 Housing Choice Voucher holders face a compounding problem. As market rents rise in these ZIP codes, the gap widens between HUD’s payment standard—set by metro-wide fair market rent calculations that typically lag actual conditions—and what landlords charge. Tenant advocacy organizations working in Orlando report increasing difficulty among voucher holders finding landlords willing to accept vouchers at all, payment standard aside.
“The legal tools are essentially nonexistent at the local level,” said a staff organizer with Organize Now, the Orlando-based tenant and workers’ rights organization. “What we’re left with is helping people understand their rights in the eviction process, connecting them to legal aid, and pushing on affordable housing production. But when someone calls because their rent just went up $400 and they have 30 days, there’s nothing we can do about the $400.”
The Hispanic Federation’s Orlando office has documented similar patterns along the Semoran corridor, where Spanish-speaking renters with limited familiarity with Florida landlord-tenant law are particularly vulnerable to informal pressure—maintenance withholding, lease non-renewal without explanation. These stop short of formal eviction but accomplish the same result. Renters navigating the legal landscape in these situations should also know that free legal help for tenant rights in Orlando is available through several local organizations.
The tools that do exist are narrow. Affordable housing deed restrictions—typically on units produced with Low Income Housing Tax Credits or city SHIP funding—provide genuine, legally enforceable affordability, but only property by property. Orlando’s SHIP allocation is meaningful. It doesn’t produce housing at anything close to the scale needed to offset the loss of naturally occurring affordable units in a metro this size. If you’re a renter in these ZIP codes without a deed-restricted affordable unit, you’re exposed to the full force of the market appreciation documented in the OCPA data. No local legal mechanism changes that. The statute doesn’t leave room for interpretation.
What to Watch Next: The Indicators That Signal a Neighborhood Is Tipping
These are the specific data signals identified in this reporting, with notes on where to find them.
Demolition permit volume is the most reliable leading indicator of neighborhood transition. When demolitions begin rising in a corridor—even modestly—it means investors have concluded that existing structures no longer justify rehabilitation relative to land value. The City of Orlando’s permitting portal and Orange County’s building division both publish permit data searchable by type and address. A spike in demolitions in 32807 or 32808 would indicate that the appreciation curve is steepening faster than current assessed-value data shows. Checking these databases takes about fifteen minutes and is worth doing monthly if you live in or report on these neighborhoods.
Single-year assessed value increases exceeding 15 percent on residential parcels was the threshold used in this analysis. Florida’s homestead exemption caps assessed value increases on owner-occupied primary residences at 3 percent annually. A 15-percent jump almost always means the property is investor-owned, recently sold, or a non-homesteaded rental. The OCPA parcel data is publicly accessible to anyone with a spreadsheet.
CRA designation or TIF district formation would signal that public investment and the appreciation it produces are being deliberately directed into a geography. A new CRA designation in 32807 or 32808 would be significant. CRA designations in Florida require a statutory finding of slum or blight conditions—a framework with its own fraught history—but if designation arrives, displacement-mitigation tools could theoretically be built into the redevelopment plan. They rarely are without organized community pressure.
Anchor institutional investment within a half-mile works as a reliable early-warning mechanism. When a hospital, university campus, stadium, or major government facility anchors a corridor, private capital follows on a predictable timeline. The Creative Village pattern is not unique to Orlando—it has been replicated here and elsewhere consistently enough that it should be treated as a forecast, not a surprise. Monitoring city capital budget filings, CRA annual reports, and county commission agenda items for facility-scale investments in these ZIP codes reveals the public sector’s intentions before market reaction becomes visible in the data.
Teardown-and-rebuild townhome construction arriving in a ZIP code that previously saw only renovation permits indicates that land values have crossed a threshold. Renovation preserves existing structures and raises rents incrementally. Teardown-and-rebuild signals that land values have risen beyond what the existing structure is worth—the building has become an obstacle rather than an asset. In 32806, reporting suggests this transition is underway in parts of the Hourglass corridor. In 32808 and 32807, it hasn’t yet arrived at scale. That’s precisely what makes those ZIP codes worth monitoring now, while the data still has predictive value rather than just documenting what already happened.
The OCPA parcel database, the City of Orlando’s permitting portal, the Orange County Building Division permit search, and CRA annual reports are all public records. The story of where Orlando’s neighborhoods are heading is already written in them. The people with the most at stake—renters currently living in these ZIP codes—deserve someone reading those records and reporting what they find. That’s what CityDesk Orlando is doing. We’ll update this analysis as data pulls are finalized and as the permit picture develops through the remainder of 2025.